Monitor & Audit Logs
How to monitor ZooKeeper with Prometheus, Grafana, and InfluxDB metrics, and how to enable and configure audit logging to track operations performed on the cluster.
New Metrics System
The New Metrics System has been available since 3.6.0. It provides rich metrics covering znodes, network, disk, quorum, leader election, clients, security, failures, watches/sessions, request processors, and more.
Metrics
All available metrics are defined in ServerMetrics.java.
Configuring the Metrics Provider
Enable the Prometheus MetricsProvider by adding the following to zoo.cfg:
metricsProvider.className=org.apache.zookeeper.metrics.prometheus.PrometheusMetricsProviderThe HTTP port for Prometheus metrics scraping can be configured with (default is 7000):
metricsProvider.httpPort=7000Enabling HTTPS for Prometheus Metrics
ZooKeeper supports SSL for the Prometheus metrics endpoint to provide secure data transmission.
Define the HTTPS port:
metricsProvider.httpsPort=4443Configure the SSL key store (holds the server's private key and certificate):
metricsProvider.ssl.keyStore.location=/path/to/keystore.jks
metricsProvider.ssl.keyStore.password=your_keystore_password
metricsProvider.ssl.keyStore.type=jks  # Default is JKS
Configure the SSL trust store (used to verify client certificates):
metricsProvider.ssl.trustStore.location=/path/to/truststore.jks
metricsProvider.ssl.trustStore.password=your_truststore_password
metricsProvider.ssl.trustStore.type=jks  # Default is JKS
HTTP and HTTPS can be enabled simultaneously by defining both ports:
metricsProvider.httpPort=7000
metricsProvider.httpsPort=4443
Prometheus
Prometheus is the easiest way to ingest and record ZooKeeper metrics.
Install Prometheus from the official download page.
Configure the scraper to target your ZooKeeper cluster endpoints:
cat > /tmp/test-zk.yaml <<EOF
global:
  scrape_interval: 10s
scrape_configs:
  - job_name: test-zk
    static_configs:
    - targets: ['192.168.10.32:7000','192.168.10.33:7000','192.168.10.34:7000']
EOF
Start Prometheus:
nohup /tmp/prometheus \
    --config.file /tmp/test-zk.yaml \
    --web.listen-address ":9090" \
    --storage.tsdb.path "/tmp/test-zk.data" >> /tmp/test-zk.log 2>&1 &
Prometheus will now scrape ZooKeeper metrics every 10 seconds.
Alerting with Prometheus
Read the Prometheus alerting documentation for alerting principles, and use Prometheus Alertmanager to receive alert notifications via email or webhook.
The following is a reference alerting rules file for common ZooKeeper metrics. Adjust thresholds to match your environment.
Validate the rules file with:
./promtool check rules rules/zk.ymlrules/zk.yml:
groups:
  - name: zk-alert-example
    rules:
      - alert: ZooKeeper server is down
        expr: up == 0
        for: 1m
        labels:
          severity: critical
        annotations:
          summary: "Instance {{ $labels.instance }} ZooKeeper server is down"
          description: "{{ $labels.instance }} of job {{$labels.job}} ZooKeeper server is down: [{{ $value }}]."

      - alert: create too many znodes
        expr: znode_count > 1000000
        for: 1m
        labels:
          severity: warning
        annotations:
          summary: "Instance {{ $labels.instance }} create too many znodes"
          description: "{{ $labels.instance }} of job {{$labels.job}} create too many znodes: [{{ $value }}]."

      - alert: create too many connections
        expr: num_alive_connections > 50 # suppose we use the default maxClientCnxns: 60
        for: 1m
        labels:
          severity: warning
        annotations:
          summary: "Instance {{ $labels.instance }} create too many connections"
          description: "{{ $labels.instance }} of job {{$labels.job}} create too many connections: [{{ $value }}]."

      - alert: znode total occupied memory is too big
        expr: approximate_data_size /1024 /1024 > 1 * 1024 # more than 1024 MB (1 GB)
        for: 1m
        labels:
          severity: warning
        annotations:
          summary: "Instance {{ $labels.instance }} znode total occupied memory is too big"
          description: "{{ $labels.instance }} of job {{$labels.job}} znode total occupied memory is too big: [{{ $value }}] MB."

      - alert: set too many watch
        expr: watch_count > 10000
        for: 1m
        labels:
          severity: warning
        annotations:
          summary: "Instance {{ $labels.instance }} set too many watch"
          description: "{{ $labels.instance }} of job {{$labels.job}} set too many watch: [{{ $value }}]."

      - alert: a leader election happens
        expr: increase(election_time_count[5m]) > 0
        for: 1m
        labels:
          severity: warning
        annotations:
          summary: "Instance {{ $labels.instance }} a leader election happens"
          description: "{{ $labels.instance }} of job {{$labels.job}} a leader election happens: [{{ $value }}]."

      - alert: open too many files
        expr: open_file_descriptor_count > 300
        for: 1m
        labels:
          severity: warning
        annotations:
          summary: "Instance {{ $labels.instance }} open too many files"
          description: "{{ $labels.instance }} of job {{$labels.job}} open too many files: [{{ $value }}]."

      - alert: fsync time is too long
        expr: rate(fsynctime_sum[1m]) > 100
        for: 1m
        labels:
          severity: warning
        annotations:
          summary: "Instance {{ $labels.instance }} fsync time is too long"
          description: "{{ $labels.instance }} of job {{$labels.job}} fsync time is too long: [{{ $value }}]."

      - alert: take snapshot time is too long
        expr: rate(snapshottime_sum[5m]) > 100
        for: 1m
        labels:
          severity: warning
        annotations:
          summary: "Instance {{ $labels.instance }} take snapshot time is too long"
          description: "{{ $labels.instance }} of job {{$labels.job}} take snapshot time is too long: [{{ $value }}]."

      - alert: avg latency is too high
        expr: avg_latency > 100
        for: 1m
        labels:
          severity: warning
        annotations:
          summary: "Instance {{ $labels.instance }} avg latency is too high"
          description: "{{ $labels.instance }} of job {{$labels.job}} avg latency is too high: [{{ $value }}]."

      - alert: JvmMemoryFillingUp
        expr: jvm_memory_bytes_used / jvm_memory_bytes_max{area="heap"} > 0.8
        for: 5m
        labels:
          severity: warning
        annotations:
          summary: "JVM memory filling up (instance {{ $labels.instance }})"
          description: "JVM memory is filling up (> 80%)\n labels: {{ $labels }}  value = {{ $value }}\n"
Grafana
Grafana has built-in Prometheus support. Add a Prometheus data source with the following settings:
Name:   test-zk
Type:   Prometheus
Url:    http://localhost:9090
Access: proxy
Download and import the default ZooKeeper dashboard template and customize it to your needs. If you have improvements to share, send them to dev@zookeeper.apache.org.
InfluxDB
InfluxDB is an open source time series database often used to store ZooKeeper metrics. You can download the open source version or create a free cloud account. In either case, configure the Apache ZooKeeper Telegraf plugin to collect and store metrics from your ZooKeeper clusters. There is also an Apache ZooKeeper InfluxDB template that includes Telegraf configuration and a pre-built dashboard to get you started quickly.
JMX
See the JMX guide for details.
Four Letter Words
See the Four Letter Words section in the Administrator's Guide.
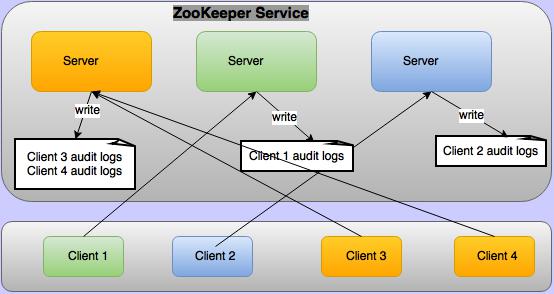
Audit Logs
Apache ZooKeeper supports audit logging from version 3.6.0. By default audit logs are disabled.
To enable them, set audit.enable=true in conf/zoo.cfg. Audit logs are not written on every
ZooKeeper server — they are written only on the servers to which a client is connected, as
illustrated below.
The audit log captures detailed information for audited operations, written as key=value pairs:
| Key | Value |
|---|---|
session | Client session ID. |
user | Comma-separated list of users associated with the client session. See Who is taken as user in audit logs? |
ip | Client IP address. |
operation | The audited operation. Possible values: serverStart, serverStop, create, delete, setData, setAcl, multiOperation, reconfig, ephemeralZNodeDeleteOnSessionClose. |
znode | Path of the znode. |
znode type | Type of the znode (only for create operations). |
acl | String representation of the znode ACL, e.g. cdrwa (create, delete, read, write, admin). Only logged for setAcl. |
result | Outcome of the operation: success, failure, or invoked. The invoked result is used for serverStop because the stop is logged before the server has confirmed it actually stopped. |
Sample audit logs for all operations, where the client connected from 192.168.1.2, client
principal is zkcli@HADOOP.COM, and server principal is zookeeper/192.168.1.3@HADOOP.COM:
user=zookeeper/192.168.1.3 operation=serverStart   result=success
session=0x19344730000   user=192.168.1.2,zkcli@HADOOP.COM  ip=192.168.1.2    operation=create    znode=/a    znode_type=persistent  result=success
session=0x19344730000   user=192.168.1.2,zkcli@HADOOP.COM  ip=192.168.1.2    operation=create    znode=/a    znode_type=persistent  result=failure
session=0x19344730000   user=192.168.1.2,zkcli@HADOOP.COM  ip=192.168.1.2    operation=setData   znode=/a    result=failure
session=0x19344730000   user=192.168.1.2,zkcli@HADOOP.COM  ip=192.168.1.2    operation=setData   znode=/a    result=success
session=0x19344730000   user=192.168.1.2,zkcli@HADOOP.COM  ip=192.168.1.2    operation=setAcl    znode=/a    acl=world:anyone:cdrwa  result=failure
session=0x19344730000   user=192.168.1.2,zkcli@HADOOP.COM  ip=192.168.1.2    operation=setAcl    znode=/a    acl=world:anyone:cdrwa  result=success
session=0x19344730000   user=192.168.1.2,zkcli@HADOOP.COM  ip=192.168.1.2    operation=create    znode=/b    znode_type=persistent  result=success
session=0x19344730000   user=192.168.1.2,zkcli@HADOOP.COM  ip=192.168.1.2    operation=setData   znode=/b    result=success
session=0x19344730000   user=192.168.1.2,zkcli@HADOOP.COM  ip=192.168.1.2    operation=delete    znode=/b    result=success
session=0x19344730000   user=192.168.1.2,zkcli@HADOOP.COM  ip=192.168.1.2    operation=multiOperation    result=failure
session=0x19344730000   user=192.168.1.2,zkcli@HADOOP.COM  ip=192.168.1.2    operation=delete    znode=/a    result=failure
session=0x19344730000   user=192.168.1.2,zkcli@HADOOP.COM  ip=192.168.1.2    operation=delete    znode=/a    result=success
session=0x19344730001   user=192.168.1.2,zkcli@HADOOP.COM  ip=192.168.1.2    operation=create   znode=/ephemral znode_type=ephemral result=success
session=0x19344730001   user=zookeeper/192.168.1.3   operation=ephemeralZNodeDeletionOnSessionCloseOrExpire  znode=/ephemral result=success
session=0x19344730000   user=192.168.1.2,zkcli@HADOOP.COM  ip=192.168.1.2    operation=reconfig  znode=/zookeeper/config result=success
user=zookeeper/192.168.1.3 operation=serverStop    result=invoked
Audit Log Configuration
Audit logging is performed using Logback. The following is the default logback configuration
block in conf/logback.xml (the entire block is commented out by default — uncomment it to
activate audit logging):
<!--
  zk audit logging
-->
<!--property name="zookeeper.auditlog.file" value="zookeeper_audit.log" />
<property name="zookeeper.auditlog.threshold" value="INFO" />
<property name="audit.logger" value="INFO, RFAAUDIT" />

<appender name="RFAAUDIT" class="ch.qos.logback.core.rolling.RollingFileAppender">
  <File>${zookeeper.log.dir}/${zookeeper.auditlog.file}</File>
  <encoder>
    <pattern>%d{ISO8601} %p %c{2}: %m%n</pattern>
  </encoder>
  <filter class="ch.qos.logback.classic.filter.ThresholdFilter">
    <level>${zookeeper.auditlog.threshold}</level>
  </filter>
  <rollingPolicy class="ch.qos.logback.core.rolling.FixedWindowRollingPolicy">
    <maxIndex>10</maxIndex>
    <FileNamePattern>${zookeeper.log.dir}/${zookeeper.auditlog.file}.%i</FileNamePattern>
  </rollingPolicy>
  <triggeringPolicy class="ch.qos.logback.core.rolling.SizeBasedTriggeringPolicy">
    <MaxFileSize>10MB</MaxFileSize>
  </triggeringPolicy>
</appender>

<logger name="org.apache.zookeeper.audit.Slf4jAuditLogger" additivity="false" level="${audit.logger}">
  <appender-ref ref="RFAAUDIT" />
</logger-->
Modify this configuration to customize the audit log filename, number of backup files, maximum file size, or to use a custom audit logger.
Who is Taken as User in Audit Logs?
There are four built-in authentication providers:
IPAuthenticationProvider— the authenticated IP address is used as the user.SASLAuthenticationProvider— the client principal is used as the user.X509AuthenticationProvider— the client certificate is used as the user.DigestAuthenticationProvider— the authenticated username is used as the user.
Custom authentication providers can override org.apache.zookeeper.server.auth.AuthenticationProvider.getUserName(String id)
to provide a user name. If a custom provider does not override this method, the value stored in
org.apache.zookeeper.data.Id.id is used as the user. Generally only the user name is stored in
this field, but it is up to the custom provider what they store there.
Not all ZooKeeper operations are initiated by clients — some are performed by the server itself.
For example, when a client session closes, any ephemeral znodes it owned are deleted by the server
directly. These are called system operations. For system operations, the user associated with the
ZooKeeper server principal is logged as the user. For example, if the server principal is
zookeeper/hadoop.hadoop.com@HADOOP.COM, it becomes the system user:
user=zookeeper/hadoop.hadoop.com@HADOOP.COM operation=serverStart result=successIf there is no user associated with the ZooKeeper server, the OS user who started the server
process is used. For example, if the server was started by root:
user=root operation=serverStart result=successA single client can attach multiple authentication schemes to a session. In that case all
authenticated identities are taken as the user and presented as a comma-separated list. For
example, if a client is authenticated with principal zkcli@HADOOP.COM and IP 127.0.0.1,
the create operation audit log will be:
session=0x10c0bcb0000 user=zkcli@HADOOP.COM,127.0.0.1 ip=127.0.0.1 operation=create znode=/a result=successTools
Reference for the scripts and tools bundled with ZooKeeper — including server management scripts, snapshot and transaction log utilities, benchmark tools, and testing frameworks.
Internals
This document covers the inner workings of ZooKeeper, including the atomic broadcast protocol, consistency guarantees, quorum design, and logging conventions.